International Journal of Mechanical Engineering and Mechatronics (IJMEM)
ISSN: 1929-2724

Volume 2 - Year 2014 - Pages 1-12
DOI: 10.11159/ijmem.2014.001
Integration of Quality Function Deployment and Functional Analysis for Eco-design
Abdulbaset Alemam¹, Simon Li²
¹Department of Mechanical and Industrial Engineering, Concordia University
1515 St. Catherine St. West, Montreal, Quebec, H3G 1M8, Canada
a_alemam@encs.concordia.ca
²Department of Mechanical and Manufacturing Engineering, University of Calgary
2500 University Drive NW, Calgary, Alberta, T2N 1N4, Canada
simoli@ucalgary.ca
Abstract - This paper proposes an eco-design method to systematically generate design concepts for the reduction of environmental impacts. The method is based on the integration of quality function deployment (QFD) and functional analysis (FA) at the early design stage. While QFD provides a framework to reflect the "voice of environment" in the design planning and evaluations, FA focuses on the functional description of the design to support the generation of design concepts. Particularly, the morphological chart is used to support the synthesis of new design concepts. The integration approach is based on the matrix-based correlation modeling to explicitly capture the links among environmental requirements, engineering metrics, design functions and components. The proposed method consists of four steps. In Step 1, the matrix-based correlation models of the existing design are constructed through QFD and FA. In Step 2, one specific environmental requirement is mapped through the correlation models in order to identify the responsible design functions and components for design generation. Afterwards in Step 3, the identified functions are used to establish the morphological chart to generate possible design solutions (or components) for each function. Then, different design concepts can be synthesized by combining these possible solutions. In Step 4, the generated design concepts can be evaluated via engineering metrics that are relevant to the original environmental requirement. A coffee maker has been selected as an application to demonstrate the proposed 4-step method.
Keywords: Design for environment, green quality function deployment, design functions, matrix-based correlation modeling.
© Copyright 2014 Authors - This is an Open Access article published under the Creative Commons Attribution License terms. Unrestricted use, distribution, and reproduction in any medium are permitted, provided the original work is properly cited.
Date Received: 2013-09-30
Date Accepted: 2014-02-23
Date Published: 2014-03-20
1. Introduction
As environment issues become more important in the design practice, this paper focuses on how to analyze and modify existing designs for reducing environmental impacts. In the "quality" culture, design improvement is often driven by customer satisfaction (i.e., voice of customers), and quality function deployment (QFD) has been widely recognized and adopted to reflect customer requirements in the design of the products [1]. In response to the environmental concerns, researchers have extended the practice of QFD to cover the "voice of environment" [2,3,4,5,6,7]. While QFD can be a good tool to reflect the concerns of stakeholders (including customers and environment), further efforts are required to integrate the results of QFD in the design process. Cristofari et al [8] have proposed Green QFD (G-QFD) to consider the environmental issues during the design stage. Afterwards, some methodical extensions have been proposed such as extending G-QFD to QFD II by integrating QFD and life cycle assessment (LCA) to evaluate different product concepts [2,7]. Yet, this paper has two new elements as research contributions. Firstly, this paper proposes the methodical feature of design concept generation using morphological chart. Notably, Sakao [9] has combined TRIZ (theory of inventive problem solving) with QFD for eco-design. Yet, we argue that morphological chart is a simpler tool (as compared to TRIZ) for engineers. Secondly, this paper proposes the functional analysis of existing designs to explore the opportunities for eco-design improvement. In this case, instead of designing new products, we focus on the modifications of existing designs.
In the next section, we will discuss the approach to integrate QFD and functional analysis (FA) for eco-design. Then, we will propose the methodical procedure along with the coffee maker example to demonstrate the research efforts. Closing remarks will be provided at the end.
2. Integration Approach
2.1. Background
The basic idea to integrate QFD and functional analysis (FA) for eco-design is to explicitly capture the information of the existing design via correlation models. Here, correlation models essentially capture the linkage information among various design elements. In this work, four specific design elements are identified according to the context of QFD and FA, and they are described as follows.
- - Requirements: these include customer and environmental requirements according to the context of QFD. These reflect the ultimate concerns related to the modification of existing designs.
- - Metrics: these also correspond to engineering characteristics in QFD, reflecting the actual performance of a design via specific engineering measures (e.g., weight, energy, etc).
- - Functions: these describe what the design is expected to perform. They are usually expressed in terms of "verb-object" pairs to describe the desired actions as the functions [10].
- - Components: these capture the design parts or solutions to fulfill the functions of the design.
In the practice of QFD, the mapping between requirements and metrics is essential so that the improvement of engineering characteristics (i.e., metrics) can actually enhance the satisfaction of customers. Some QFD experts have also suggested the extension to map between metrics and components (termed as QFD II) to connect the design solutions with the proper engineering measures [9, 11]. In this sense, we suggest that the practice of QFD basically provides the mapping from requirements to metrics to components.
In the practice of FA, one key procedure is to model the connections between various design functions in terms of material, energy and information flows. In turn, Stone and Wood [10] organized and represented these functions and flows via functional block diagrams. In addition, components are suggested to fulfil the functions, and it is similar to the practice of mapping functional requirements and design parameters in axiomatic design which was developed by Suh [12]. In fact, morphological chart is based on the functional descriptions to combine various components (or solutions) for design concept generation [13]. In this sense, we suggest that the practice of FA basically provides the mapping from functions to components.
Notably, the traditional practice of QFD does not include the information of functions in the methodology. The lack of functional descriptions makes QFD not exactly a proper tool for design concept generation. One deliverable of this paper is to show the integration of QFD and FA to generate new concepts for eco-design. The next sub-section will present the correlation modeling for the integration.
2.2. Matrix-based Correlation Modeling
2.2.1. Domain of QFD
In the practice of QFD, suppose that engineers have identified k requirements to reflect the needs of customers and the environment. Let R = {r1, r2, ..., ri, ..., rk} be the set of k requirements that cover both the "voice of customers" and the "voice of environment". The ultimate goal of a design is to satisfy these requirements.
To gauge and control the satisfaction of requirements, QFD suggests the mapping from requirements to engineering metrics. Let M = {m1, m2, ..., mj, ..., ml} be the set of l metrics that can be used to measure the engineering properties of a design. Then, a correlation model can be built using matrix representation to reflect the mapping between requirements (i.e., R) and metrics (i.e., M). Let RM = [rmij] be the correlation matrix between R and M, where rmij indicates the strength (or relevance) of the jth metric (i.e., mj) towards the satisfaction of the ith requirement (i.e., ri). Note that RM is a k-by-l matrix that is equivalent to the relationship matrix in the context of QFD.
Following the practice of QFD II, engineers can be a further mapping from metrics to components. Let C = {c1, c2, ..., cj, ..., cq} be the set of q components, and MC = [mcij] be the correlation matrix between M and C. In this model, MC is an l-by-q matrix, and mcij indicates the relevance of the jth component to affect the engineering property measured in the ith metric.
In sum, through the practice of QFD, we are able to obtain two matrix-based correlation models: RM and MC matrices.
2.2.2. Domain of FA
In the practice of FA, one major deliverable is a functional block diagram to describe the connection of different functions of a product. A function can be conceptually viewed as a conversion process among materials, energy and information [10]. For example, suppose that one function is to "heat up water". Then, the inputs of this function is energy and cold water (as one material), and the outputs can be dissipated heat and hot water after the conversion. In this work, let F = {f1, f2, ..., fi, ..., fp} be the set of p functions of a product.
The functional description of a product is one important step towards design creativity and concept generation. For example, the function "heat up water" does not imply how this function can be achieved. By focusing on this functional description, engineers can be unlocked from existing solutions and explore the possible ways to achieve this function (e.g., energy source from fire, electricity or sun). Using a morphological chart, engineers can brainstorm and organize the possible solutions for individual functions, and synthesize some potential design concepts.
As the notion of components captures the design parts or solutions, a correlation model is built to reflect what components are used to satisfy specific functions. Let FC = [fcij] be the p-by-q correlation matrix between functions (i.e., F) and components (i.e., C), where fcij indicates the strength (or relevance) of the jth component (i.e., cj) to satisfy the ith function (i.e., fi).
In sum, through the practice of FA, we obtain one matrix-based correlation model: FC.
2.3. Strategy for Eco-design
For eco-design, the basic strategy is to translate the environmental requirements to the functional description of the design. In such a way, we focus on the corresponding functions to generate possible design solutions for improvement. To achieve this, the four-step eco-design process is proposed as follows.
Step 1: Construction of correlation models of the existing design
In the eco-design process, it is assumed that we have the existing design as the reference, for which we want to reduce the environmental impacts. Through the practice of QFD and FA, engineers can analyze the design information and define the lists of requirements (R), metrics (M), components (C) and functions (F). In addition, the correlation matrices are defined via RM, MC and FC.
Step 2: Mapping of Environmental Requirements to Functions
The request of reducing environmental impacts should be reflected explicitly in the list of requirements (i.e., voice of environment). Through the correlation models, the relevant requirements can be mapped to the corresponding metrics via RM and then to components via MC. At this point, engineers can identify a subset of responsible components that should be modified for eco-design.
Yet, focusing on the responsible components may not be effective for generating new solution concepts since engineers are somewhat locked in the concept of the existing design. Consider the coffee maker example in Section 3. To keep the coffee warm, focusing on the hot plate may lead to the solutions of modifying the warming cycling or the size of the hot plate. If we focus on the function "warm coffee", we can imagine other possible solutions such as using an insulated cup. Thus, the responsible components are further mapped to the functions via FC. The subset of functions that are responsible for eco-design becomes the output of this step.
Step 3: Generation of Design Concepts via Morphological Chart
Given the responsible functions, engineers can initiate the concept generation process using morphological chart. In this chart, engineers are asked to propose various possible solutions to satisfy each of the functions. To synthesize a design concept, one possible solution is picked for each function. For example, suppose that a design consists of two functions: f1 and f2, and each function has two possible solutions (or components), symbolically, f1 with c1a and c1b and f2 with c2a and c2b. To synthesize a design concept, we need one solution for each function. Thus, there can be four possible design concepts as the outcome: {c1a, c2a}, {c1b, c2a}, {c1a, c2b} and {c1b, c2b}.
Notably, the possible number of design concepts can expand rapidly with the number of solutions for each function. In practice, we do not need to investigate all logically possible design concepts. The solution space should be treated as the source of design inspiration, and engineers should exercise their judgments to filter some promising design concepts.
Step 4: Evaluation of Design Concepts
After obtaining several design concepts from the previous step, these concepts can be evaluated via the existing correlation models. Particularly, new design concepts only modify some components in the correlation models. Thus, the new component information can be mapped to the functions and then to metrics and requirements. It is similar to the reverse mapping process in Step 2. Accordingly, engineers can evaluate how the new components can affect the related metrics and the satisfaction of relevant requirements. Based on the metric evaluation, engineers can objectively assess the design concepts towards the satisfaction of requirements. As this paper focuses on the concept generation, the details of the quantitative analysis are skipped.
3. Application
3.1. Example: Coffee Maker
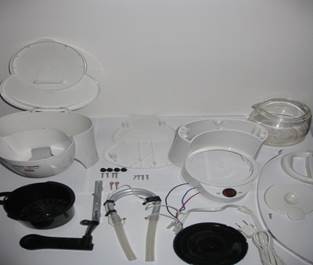
This section aims to demonstrate the proposed eco-design method using a household coffee maker as an example. Figure 1 shows the parts of the coffee maker after the disassembly. The basic research question is how to systematically redesign this product for reducing environmental impacts. The methodical steps for demonstration are provided in the following sub-sections.
3.2. Construction of the Correlation Models (Step 1)
The coffee maker is first analyzed in view of requirements (R), metrics (M), functions (F) and components (C). This information is assumed available since it is an existing design, and the engineers of the company should be able to access such information. In this study, we have defined and shown the lists of requirements, metrics, functions and components in Table 1, which the labels of these design elements are also defined (e.g., r1, m1, etc).
Table 1. List of requirements, metric, functions and components.
|
Requirements (R) |
Metrics (M) |
Functions (F) |
Components (C) |
|
r1: Safe operation r2: Comfortable to hold r3: Heat quickly r4: High filtering efficiency r5: Load capacity r6: Durable r7: Low cost r8: Automatic shut off r9: Less material usage r10: Less energy consumption r11: Light weight r12: Easy to disassemble r13: Reheat option
|
m1: Amount of energy m2: Thermal distribution m3: Filter efficiency m4: Lifespan m5: Toxicity of materials m6: Weight m7: Types of materials m8: Glass volume m9: Noise and vibration m10: Reheat temperature
|
f1: Receive coffee materials f2: Mix hot water and powder f3: Filter out coffee powder f4: Facilitate materials removal f5: Distribute electricity f6: Heat water f7: Warm brewed coffee f8: Dissipate heat f9: Distribute weight
|
c1: Carafe (thermo flask) c2: Filter body c3: Temporary filter c4: Top housing c5: Base housing c6: Heater cover plate c7: Heater plate c8: Base (hot plate) c9: Water spreader
|
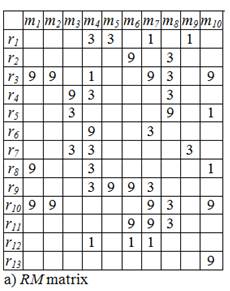
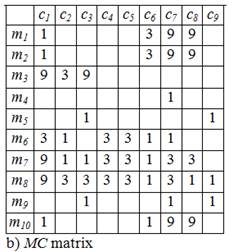
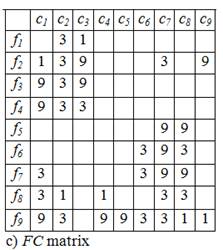
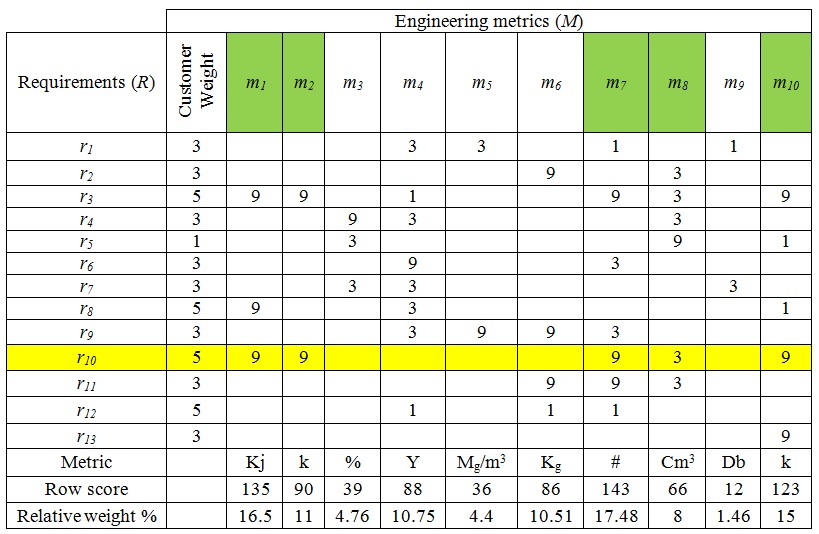
Afterwards, three types of correlation matrices are built. These matrices have three levels of correlation strengths: weak (= 1), medium (= 3) and strong (= 9), and these levels are set based on the traditional practice in QFD. The matrix entries are left blank for the absence of correlation. In addition, for rating the importance of customer requirements, three levels are also selected: very important (= 5), important (= 3) and relatively important (= 1). Figure 2 shows the correlation matrices: RM, MC and FC.
3.3. Mapping of Environmental Requirements to Functions (Step 2)
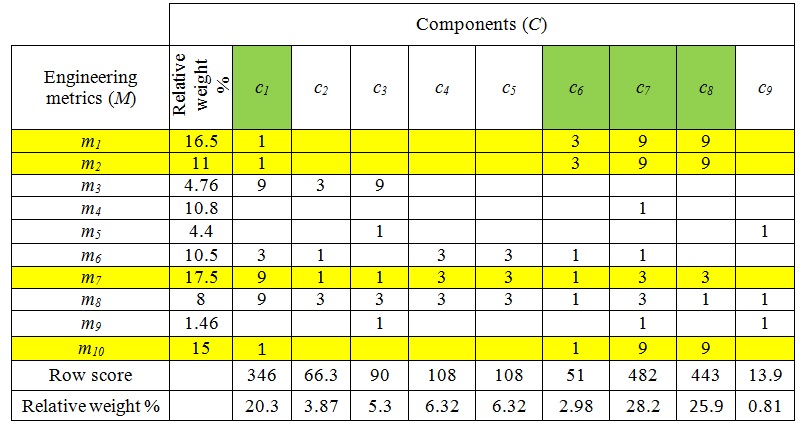
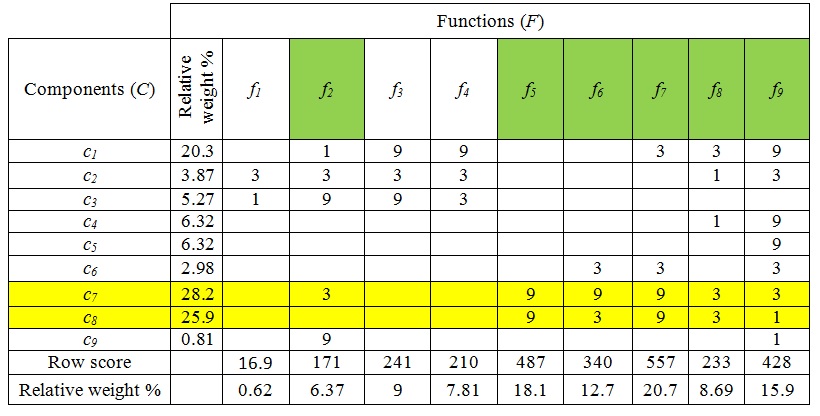
Suppose that the incoming environmental requirement is the reduction of energy consumption. From Table 1, it is related to r10, which can be found in the RM matrix. Figure 3 shows the RM matrix with the highlight of r10 to track the related metrics, which are m1, m2, m7, m8 and m10. Here, m8 is removed from further mapping since it has a relatively weaker correlation to r10. Then, the further mapping is carried out in the MC matrix, and it is highlighted in Figure 4. By checking their correlation strengths, we can observe that c7 and c8 are strongly related to these metrics. Thus, c7 and c8 are further mapped via the FC matrix, and it is highlighted in Figure 5. Again, by checking the correlation strengths, we identify that f5, f6 and f7 are strongly related to these components, and they become the focus of eco-design.
3.4. Generation of Design Concepts (Step 3)
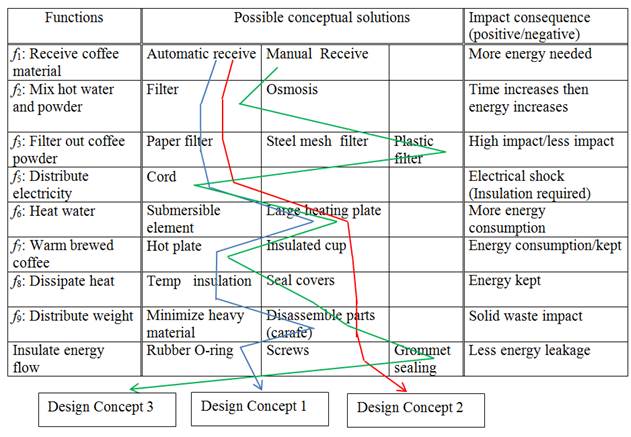
The concept generation approach is based on the morphological chart, which is shown in Figure 6 for this application. The first column of the morphological chart lists the functions of the coffee maker. Then, engineers are asked to propose possible solutions for each function. For example, to warm brewed coffee (i.e., f7), we may use the "hot plate" or the "insulated cup", which are listed as possible conceptual solutions along the row of this function. Then, the engineers can combine various conceptual solutions to come up with different design concepts, which are also shown in Figure 6 for this application.
By focusing on the relevant functions, f5, f6 and f7 identified in the previous step, the engineers need to investigate the opportunities for reducing energy consumption. When considering f6 (i.e., Heat water), it is noted that there should be some better ways to "insulate the energy flow," which becomes a new function for new design opportunities. This new function is also included in the morphological chart in Figure 6.
3.5. Evaluation of Design Concepts (Step 4)
By checking Step 2 and Figure 4, we have identified that the metrics m1, m2, m7 and m10 are relevant to this eco-design. Thus, we evaluate the proposed design concepts with these metrics with the 5-point scale to indicate the environment impact. Specifically, the 5-point scale ranges from zero (very low impact) to four (very high impact). After the evaluations of each design concept, the grade points are summed with consideration of the metrics relative weight to yield the overall assessment. Below is an example of how to calculate the total score of the environmental impacts of design concept 1:
The total score = 3 * 0.165 + 3 * 0.11 + 4 * 0.1748 + 3 * 0.15 = 1.97
The evaluation results are provided in Table 2. The discussion for each design is provided as follows.
- Concept 1. Since the design includes large heating plate and hot plate, the expected energy consumption is high. Also, as the focus is to insulate the temperature by using O-ring components, the score which has been given to the amount of energy is high (3). In view of the types of the materials, since it frequently uses consumed papers, the environmental impact has been evaluated as "very high" (4). The reheat option is considered when we have the hot plate option and the type of material usage. Hot plate is available and the suggested material is aluminum. Thus, the score which has been given is high (3).
- Concept 2. For the amount of energy, there is no hot plate for warming brew coffee (f7). Thus, the score which has been given for the amount of energy is medium (2). Also, since there is no reheat option, the score is very low (0) (no hot plate).
- Concept 3. For the types of materials, there is no temporary filter. Instead, it has a permanent plastic filter. In terms of the amount of energy and thermal distribution, the scores are as same as Concept 1, and the given scores are high (3). In addition, the evaluation of types of materials is medium (2) because there is no paper filter.
After the discussion and the overall assessment, we consider that Concept 2 is the promising design for reducing environmental impacts.
Table 2. Evaluation of design concepts.
|
|
m1: Amount of energy |
m2: Thermal distribution |
m7: Types of materials |
m10: Reheat temperature |
Total score |
|
Concept 1 |
3 (high) |
3 (high) |
4 (very high) |
3 (high) |
1.97 |
|
Concept 2 |
2 (medium) |
2 (medium) |
4 (very high) |
0 (very low) |
1.25 |
|
Concept 3 |
3 (high) |
3 (high) |
2 (medium) |
3 (high) |
1.62 |
|
Metrics relative weight % |
16.5 |
11 |
17.48 |
15 |
|
4. Conclusion
This paper has proposed the eco-design method that supports the generation of design concepts for reducing environmental impacts. The key technique of the proposed method is to integrate the functional descriptions of a product in the framework of QFD for eco-design. The integration is done based on the unified correlation models represented in a matrix format. The proposed method has been demonstrated through an example of a coffee maker. In the future work, we consider the QFD practice has a solid ground for design planning and the FA practice for conceptual design. Yet, certain features of these practices have not been incorporated in our current method such as benchmarking and tradeoff analysis. The proposed method provides a solid framework for the extension to include more features for the eco-design method.
References
[1] Y. Akao "Quality Function Deployment: Integrating Customer Requirements into Product Design", New York, Productivity Press, 1990, pp. 392. View Book
[2] Y. Zhang "Green QFD-II: A Life Cycle Approach for Environmentally Conscious Manufacturing by Integrating LCA and LCC into QFD Matrices", International Journal of Production Research, Vol. 37, 1999, pp. 1075-1091. View Article
[3] H. Kaebernick, S. Kara, M. Sun "Sustainable Product Development and Manufacturing by Considering Environmental Requirements", Robotics and Computer Integrated Manufacturing, Vol. 19, 2003, pp. 461-468. View Article
[4] C. Kuo, H. Wub, I. Shieh "Integration of Environmental Considerations in Quality Function Deployment by Using Fuzzy Logic", Expert Systems with Applications, Vol. 36, 2009, pp. 7148-7156. View Article
[5] S. Devanathan, D. Ramanujan, W. Bernstein, F. Zhao, K. Ramani "Integration of Sustainability into Early Design through the Function Impact Matrix", ASME Journal of Mechanical Design, Vol. 132, 2010, P. 081004-1. View Article
[6] K. Masui, T. Sakao, M. Kobayashi, A. Inaba "Applying Quality Function Deployment to Environmentally Conscious Design", International Journal of Quality & Reliability Management, Vol. 20, 2003, pp. 90-106. View Article
[7] G. Rathod, S. Vinodh, U. Madhyasta "Integration of ECQFD and LCA for Enabling Sustainable Product Design in an Electric Vehicle Manufacturing Organisation", International Journal of Sustainable Engineering, Vol. 4, 2009, pp. 202-214. View Article
[8] M. Cristofari, A. Deshmukh, B. Wang "Green Quality Function Deployment", Proceedings of the 4th International Conference on Environmentally Conscious Design and Manufacturing, July 23-25, Cleveland, Ohio, 1996, pp. 297-304.
[9] T. Sakao "A QFD-Centred Design Methodology for Environmentally Conscious Product Design", International Journal of Production Research, Vol. 45, 2007, pp. 4143-4162. View Article
[10] R. Stone, K. Wood "Development of a Functional Basis for Design", ASME Journal of Mechanical Design, Vol. 122, 2000, pp. 359-370. View Article
[11] J.R. Hauser, D. Clausing "The House of Quality", Harvard Business Review, Vol. 66, 1988, pp. 63- 73. View Article
[12] N.P. Suh "Axiomatic Design: Advances and Applications", Oxford University Press, New York, 2001. View Book
[13] K. Otto, K. Wood "Product Design: Techniques in Reverse Engineering and New Product Development", Prentice Hall, New Jersey, 2001. View Book